
Learn about hypothesis testing in Statistics, confusion matrix, types of hypothesis testing errors, Type 1 and Type 2 Errors.
What is hypothesis testing in statistics?
Statistics is full of data, and to find out the critical interpretation from the data, we use Hypothesis Testing.
Definition:
Hypothesis Testing helps evaluate two or more mutually exclusive statements on a population using a sample of data from the population.
Examples:
In the court of law, in a criminal case, there are two statements. One is the defendant guilty, and the other exclusive to that is that the defendant is innocent. Hypothesis testing helps in arriving at the correct result with the data or evidence from the case.
Steps in Hypothesis Testing
Step 1:
Make an initial assumption that a particular statement is correct. The initial assumption is Null Hypothesis (H0). Contradictory to the Null Hypothesis is called Alternate Hypothesis (H1).
Step 2:
Start collecting information or insights from the data. In the example above, to prove a defendant is innocent or guilty, we have to collect DNA, Fingerprint, and alibi information.
Step 3:
After gathering sufficient evidence to infer. Based on the evidence or data insights, we will either accept the Null Hypothesis or Alternate Hypothesis.
In the real-time scenario where the population is enormous, we will be analysing the data, i.e., sample data arrived from the population and not entirely on the population. Based on the result of the Sample Data, we will conclude the entire population itself.
In the sample data, if we have enough insights that the H0 or the Null Hypothesis is correct, we will directly approve H0 and reject the H1 or the Alternate Hypothesis.
Confusion Matrix in Hypothesis Testing
A confusion matrix, in predictive analytics is an in pairs table that lets us know the pace of false positives, false negatives, true positives and true negatives for a test or indicator. We can make a confusion matrix if we know both the predicted and actual values for a sample set.
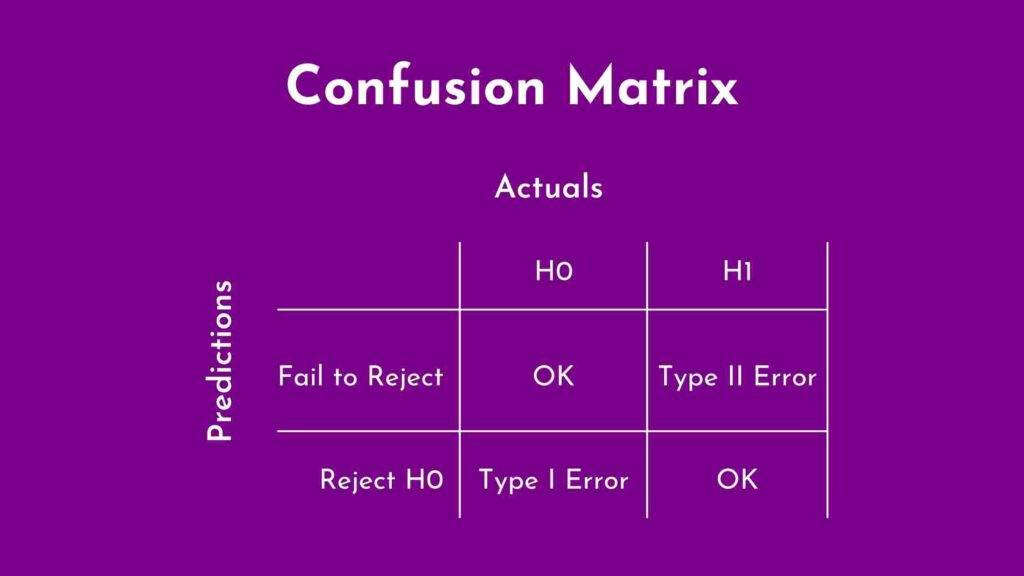
Inference 1: If we have enough evidence and insight to prove the Null Hypothesis is correct, it is OK. 1st Row 1st Column
Inference 2: If we have enough evidence and insight to reject the Alternate Hypothesis, it is OK. 2nd row 2nd Column
Inference 3: If we know that H0 is correct, but we do not have enough evidence to “Do not reject H0”, this scenario is incorrect and called a Type I Error.
Inference 4: If we know that H0 is correct, but we do not have enough evidence to “Reject H1”, and we do not have enough evidence to prove H0, this scenario is incorrect and called a Type II Error.
Type I and Type II errors can be catastrophic, and we have to take extra caution to arrive at the correct results.
Now that we have learnt about Hypothesis Testing in Statistics, we can read about Sampling in Statistics. If you are interested in learning Data Analysis, we can check out our R Programming course by Ampersand Academy.