
Learn about Distribution in Statistics and various types of Distribution in Statistics with examples and charts
Definition of Distribution:
Distribution is a function that shows the possible value for variables and how often they occur.
Distribution in Statistics means listing all possible data in the sample space and how frequently they occur. In statistics, usually, if we mean Distribution, it generally implies Probability Distribution. Few examples of Distribution include
- Normal
- Binomial
- Uniform
- Skewed – Left and Right
- Bimodal Distribution
Each probability distribution is associated with the graph describing the likelihood of occurrence of a particular event.
We can take a simple example of explaining the Distribution considering the example of Rolling a Dice.
Rolling dice can produce a 1, 2, 3, 4, 5, 6. The chance of getting a 1 is 1/6, likewise for each turn-up, the probability is 1/6th. Whereas the likelihood of getting a 7 is 0. You’ll find that the Distribution of getting the side 1 to 6 is uniform. Now let’s discuss the various type of Distribution, using examples.
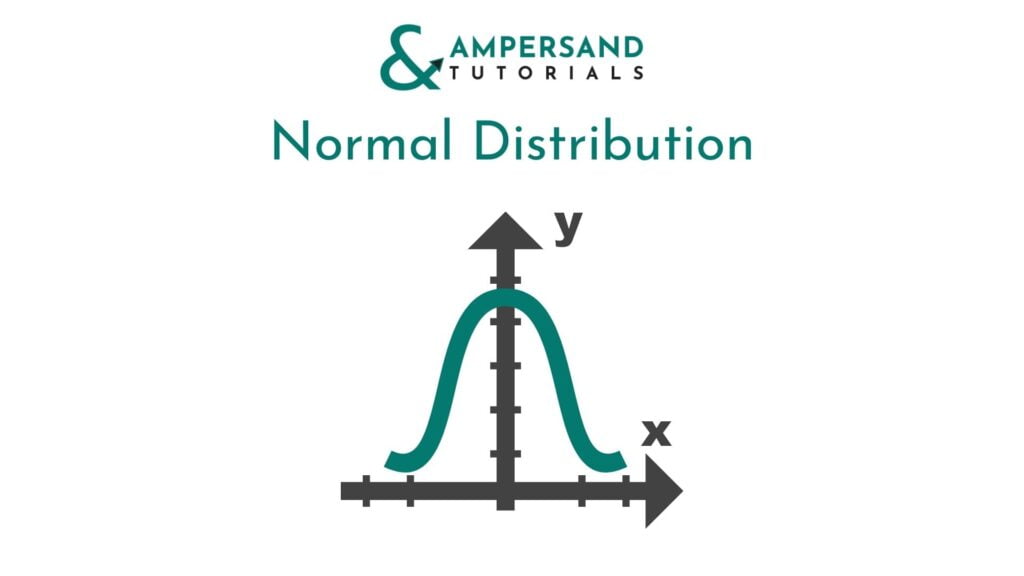
Normal Distribution:
Normal Distribution looks like a Bell Curve with the maximum probability of occurrence at the centre and minimum at the proximities. If you have to choose any particular event, there is a good chance that you’ll select from the centre. We can take a classic example of players height in the Indian Cricket Team, and when we plot, we can see that Rarely Crickets will be less than 1.5m in height and not more than 1.9m. Most of the players will fall between 1.7 to 1.8. This curve will have symmetry, as mentioned below.
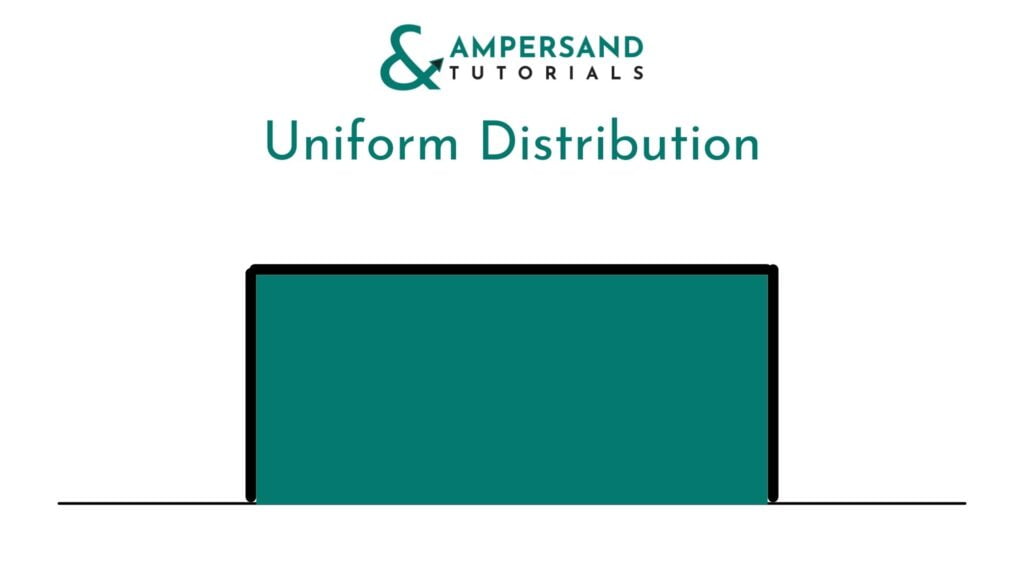
Uniform Distribution:
Uniform Distribution is where the probability of occurrence of all the possible outcomes is equal. In the example of rolling a dice, the possibility of getting 1 to 6 is 1/6. The Uniform Distribution looks like the graph given below.
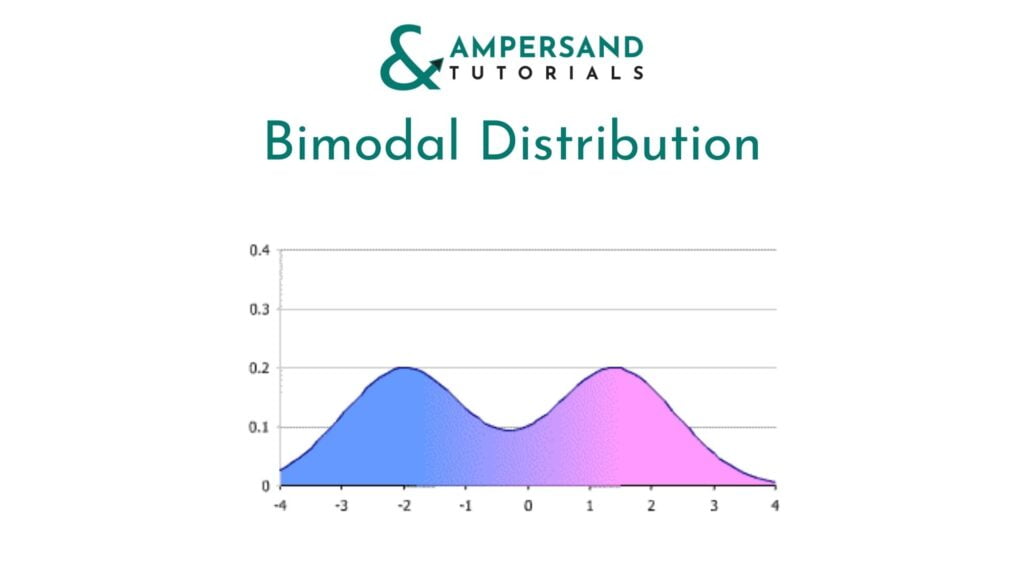
Bimodal Distribution:
Bimodal Distribution has two sets of peaks or modes around which other possibilities distribute. The following chart is the classic example of Bimodal Distribution:
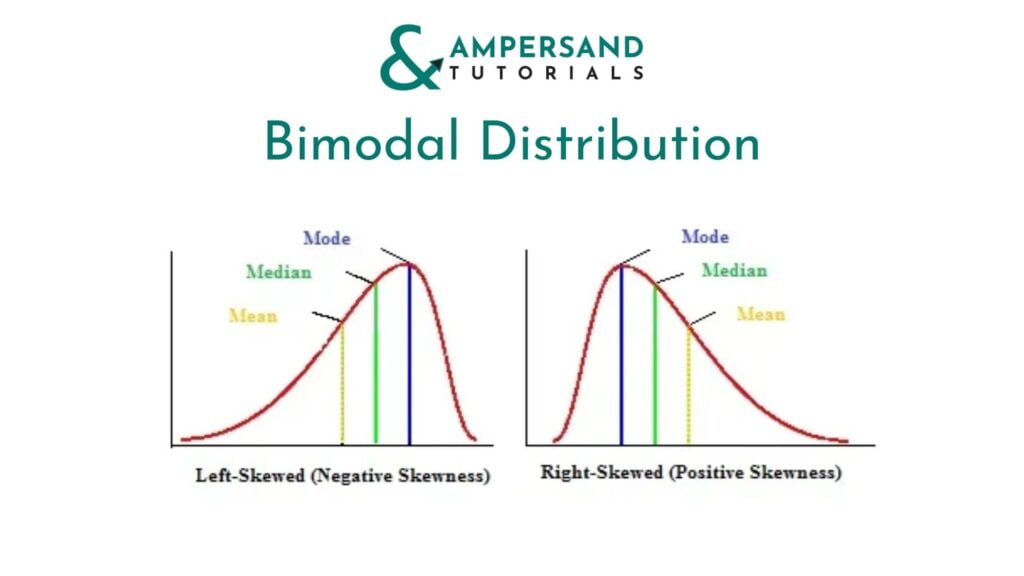
Skewed Distribution:
Skewed Distribution is where one side of the Distribution is larger than the other. If the larger side is right, it is called Left Skewed Distribution; if the larger side is left, it is called Right Skewed Distribution.
Now that you’ve read Distribution in Statistics, you can also read about the Data types in Statistics. If you’re looking to enrol for Data Analytics, check our training institute Ampersand Academy.