


Quick answer: To view HTTP requests and responses in Google Chrome, open DevTools with the F12 key or by right-clicking and choosing Inspect. Click the Network tab, reload the page, and you will see every request Chrome made. Select any row to view its headers, preview, response body, and timing details.
In the previous tutorial, we have discussed how the web works. In this tutorial, we will learn how to view HTTP Requests and Responses using Google Chrome Dev Tools.
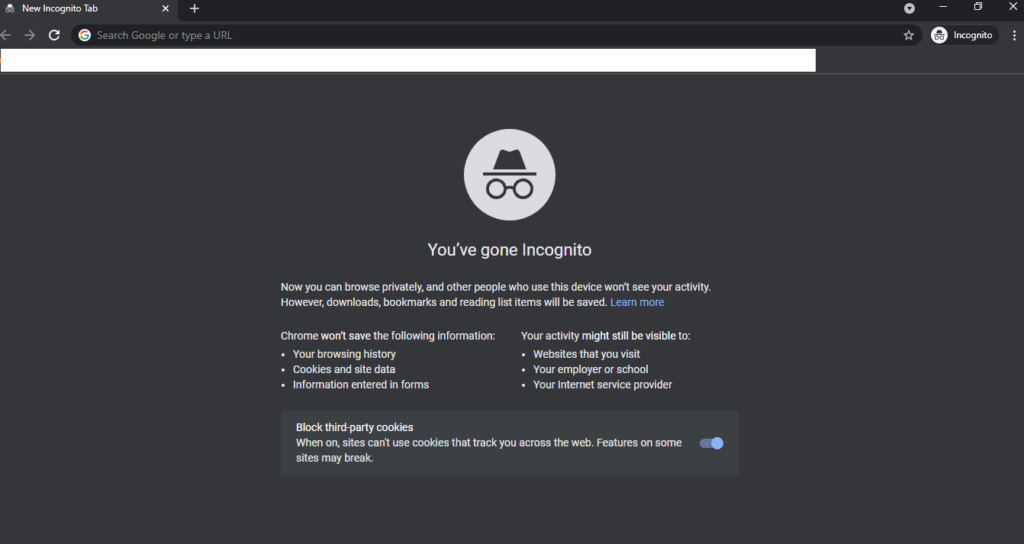
To understand how to view HTTP Requests and Responses, we will first open Google Chrome and use Google Chrome Dev Tools to learn.
Step 1: Open Google Chrome

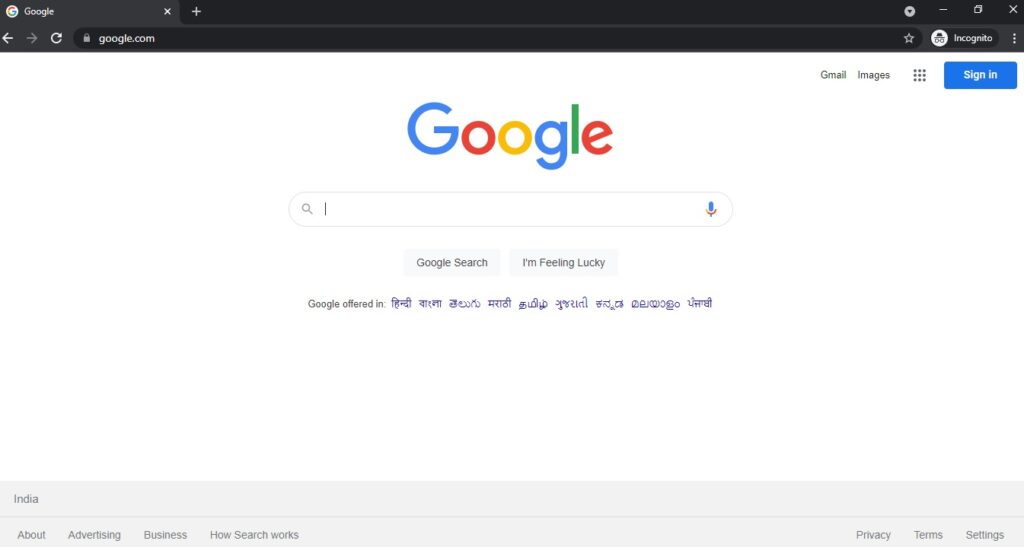
Step 2: Open the website Google.com

Step 3: If you’re using MAC OS, you can navigate to the View, Developer and Developer Tools. In case if you’re using Windows, you can use the shortcut Control + Shift + J or press the F12 key.

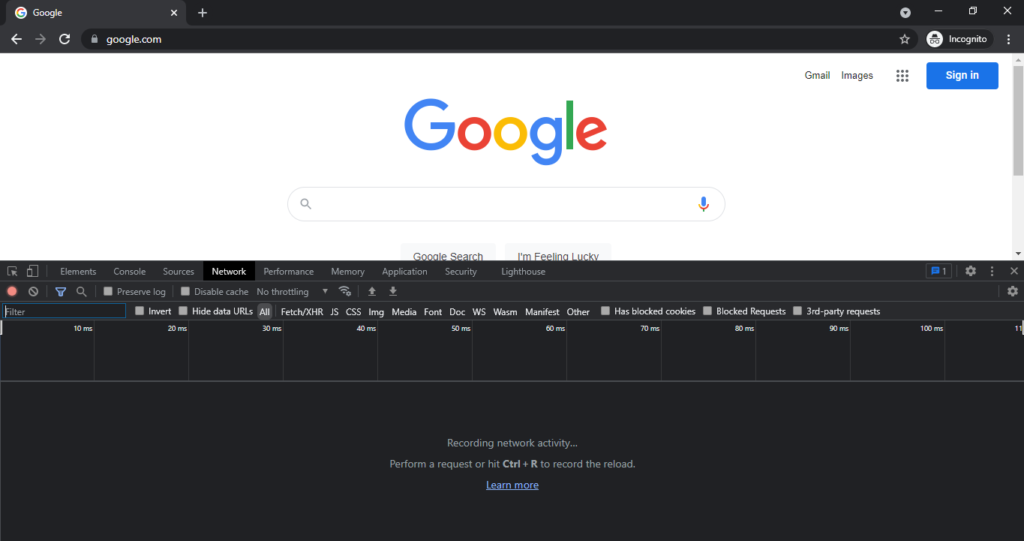
Step 4: It will open a Chrome Dev Tools Tab at the bottom. It will contain many tabs such as Elements, Console, Source, Network, Performance, Memory, Application. To study HTTP Requests and Responses, we can navigate to the Network Tab.
Please note, by default Chrome Dev Tools will dock at the bottom; however, by clicking the vertical ellipsis, we can anchor it to Left, Right, Bottom, or open in a new window. Usually, the front-end developers prefer docking the Chrome Dev Tools to the Left.

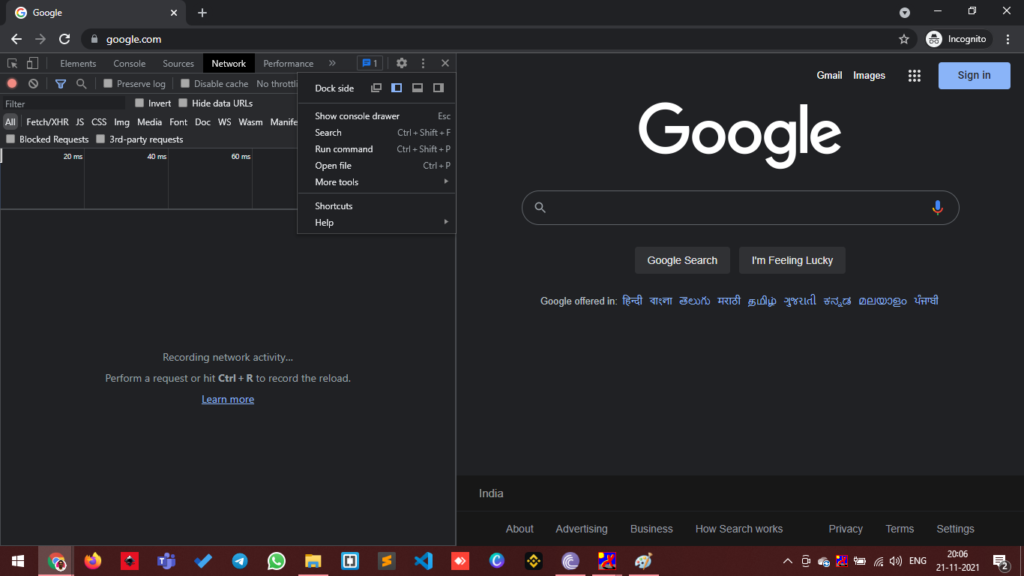
Step 5: Once inside the Chrome Dev Tools, Press Control + R to reload the Window. We reload the Window to send requests from the browser to the server. This action will list the HTTP Requests. At the bottom, we can see the total number of requests, data transferred and more.

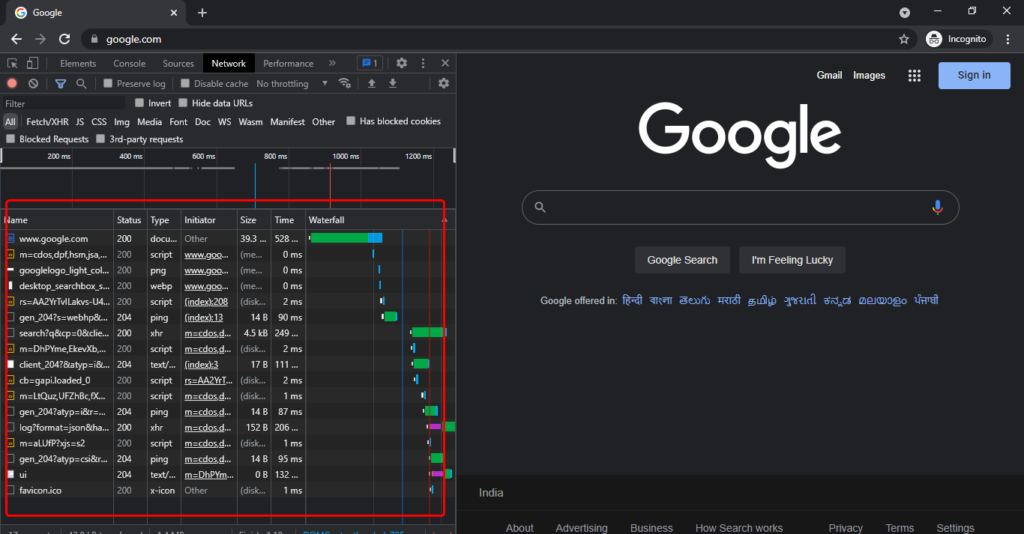
Step 6: We can observe the Method of the Request, Status of the Request, Type of the Request.
Step 7: Once we click on a particular Request, we can see more details such as Headers, Preview and more. Inside Headers, there are several other headers types, and inside Preview, we will see the Live Preview of the HTML document.

Now that you have learnt about how to view HTTP Requests and Responses. You can check out our courses at Ampersand Academy
Keep going — the 2026 roadmap shows where HTTP fits in your learning path.
Frequently asked questions
How do I open Chrome DevTools to see network traffic?
Press F12 on your keyboard, or right-click the page and choose Inspect, then click the Network tab to record requests.
Why is my Network tab empty when I open it?
Requests only record after the tab opens. Clear the list, then reload the page so Chrome logs the fresh traffic.
Where do I find the response body in DevTools?
Click a request in the Network tab and open the Response panel to see the raw data the server sent back.